500 câu trắc nghiệm Kinh tế lượng – 2B

Tổng hợp 500 câu trắc nghiệm + tự luận Kinh tế lượng (Elementary Statistics). Tất cả các câu hỏi trắc nghiệm + tự luận đều có đáp án. Nội dung được khái quát trong 13 phần, mỗi phần gồm 3 bài kiểm tra (A, B, C). Các câu hỏi trắc nghiệm + tự luận bám rất sát chương trình kinh tế lượng, đặc biệt là phần thống kê, rất phù hợp cho các bạn củng cố và mở rộng các kiến thức về Kinh tế lượng.
Các câu hỏi trắc nghiệm + tự luận của phần 2B bao gồm:
SHORT ANSWER. Write the word or phrase that best completes each statement or answers the question. Identify as many similarities and differences that you can find.
1) Suppose you are comparing frequency data for two different groups, 25 managers and 150 blue collar workers. Why would a relative frequency distribution be better than a frequency distribution?
Answers will vary depending on examples given. However, since 150 is six times 25, relative frequencies adjust for the extreme difference in sample sizes.
2) Without calculating the standard deviation, compare the standard deviation for the following three data sets. (Note: All data sets have a mean of 30.) Which do you expect to have the largest standard deviation and which do you expect to have the smallest standard deviation? Explain your answers in terms of the formula
\(s = \sqrt {\frac{{\sum {\left( {x – \bar x} \right)} }}{{n – 1}}} \) (This is formula 2-4.)
30, 30, 30, 30, 30, 30, 30, 30, 30, 30
20, 25, 25, 30, 30, 30, 30, 35, 35, 40
20, 20, 20, 25, 25, 35, 35, 40, 40, 40
Since the standard deviation measures average spread from the mean, the first data set, which shows no variation, has the smallest standard deviation, zero. The last data set would have the most variation because the mean is not in the set, and the values are more spread out from 30 in comparison to the middle data set where four values equal 30.
Solve the problem.
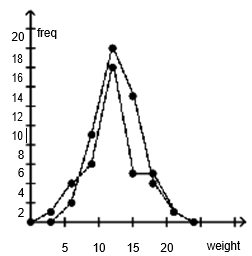
3) The frequency distribution below shows the amount of weight loss during the first month of a
diet program for both males and females. Compare the results and determine whether there appears to be a significant difference between the two genders.

There does not appear to be a significant difference.

MULTIPLE CHOICE. Choose the one alternative that best completes the statement or answers the question.
Use the pie chart to solve the problem.
4) The pie chart below gives the inventory of the men’s department of a store.

What is the total inventory?
○ $129,504
○ $124,392
○ $86,904
● $126,948
Find the mean for the given sample data.
5) Frank’s Furniture employees earned the following amounts last week:
$310.03 $154.07 $259.17 $196.57 $372.14 $318.15 $369.45 $381.28 $261.00
What was the mean amount earned by an employee last week? Round your answer to the
nearest cent.
○ $327.73
● $291.32
○ $284.65
○ $374.55
Find the median for the given sample data.
6) The weights (in ounces) of 21 cookies are shown. Find the median weight.
0.77 1.43 0.82 1.62 0.70 0.79 1.10
1.43 1.53 0.91 0.77 1.48 1.16 0.66
0.47 1.48 0.79 1.16 1.72 0.70 0.56
● 0.91 ounces
○ 0.79 ounces
○ 0.66 ounces
○ 1.43 ounces
7) Find the mode(s) for the given sample data: 20, 21, 46, 21, 49, 21, 49
○ 49
○ 46
● 21
○ 32.4
Find the midrange for the given sample data.
8) The speeds (in mph) of the cars passing a certain checkpoint are measured by radar. The results
are shown below. Find the midrange.
44.4 41.8 42.9 40.7 43.5
40.1 44.6 41.9 44.4 42.0
43.5 41.9 40.7 43.5 41.8
○ 42.25
● 42.35
○ 42.0
○ 4.50
Solve the problem.
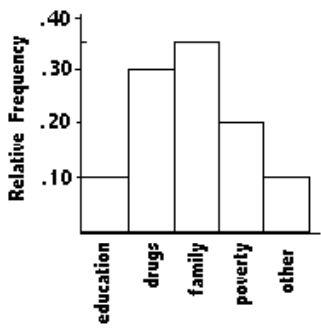
9) At the National Criminologists Association’s annual convention, participants filled out a
questionnaire asking what they thought was the most important cause for criminal behavior. The tally was as follows.
| Cause | Frequency |
| education | 49 |
| drugs | 147 |
| family | 98 |
| poverty | 171.5 |
| other | 24.5 |
Select the Pareto chart that displays these findings.
○ 
● 
○ 
○ 
Find the mean of the data summarized in the given frequency distribution.
10) The manager of a bank recorded the amount of time each customer spent waiting in line during peak business hours one Monday. The frequency distribution below summarizes the results. Find the mean waiting time. Round your answer to one decimal place.
| Waiting time (minutes) | Number of customers |
| 0 – 3 | 13 |
| 4 – 7 | 9 |
| 8 – 11 | 9 |
| 12 – 15 | 8 |
| 16 – 19 | 4 |
| 20 – 23 | 3 |
| 24 – 27 | 1 |
○ 13.5 min
○ 6.7 min
○ 9.2 min
● 9.0 min