500 câu trắc nghiệm Kinh tế lượng – 2A

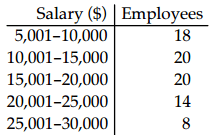
Find the mean of the data summarized in the given frequency distribution.
10) A company had 80 employees whose salaries are summarized in the frequency distribution
below. Find the mean salary.

○ $14,287.95
○ $17,500
● $15,875.50
○ $17,463.05
Find the range for the given data.
11) Fred, a local mechanic, gathered the following data regarding the price, in dollars, of an oil and
filter change at twelve competing service stations:
32.95 24.95 26.95 28.95
18.95 28.95 30.95 22.95
24.95 26.95 29.95 28.95
Compute the range.
○ $12
○ $10
○ $8
● $14
Find the variance for the given data. Round your answer to one more decimal place than the original data.
12) Compute the variance. The owner of a small manufacturing plant employs six people. As part of their personnel file, she asked each one to record to the nearest one-tenth of a mile the distance they travel one way from home to work. The six distances are listed below:
52 38 15 24 15 39
● 222.7
○ 38.9
○ 32.5
○ 167.4
Find the standard deviation for the given data. Round your answer to one more decimal place than the original data.
13) To get the best deal on a CD player, Tom called eight appliance stores and asked the cost of a specific model. The prices he was quoted are listed below:
$249 $195 $162 $446 $279 $214 $307 $187
Compute the standard deviation s.
○ $578,041.0
● $91.3
○ $233.0
○ $519,690.1
Use the range rule of thumb to solve the problem.
14) The heights in feet of people who work in an office are as follows. Use the range rule of thumb to estimate the standard deviation. Round results to the nearest tenth.
5.7 6.0 5.8 5.4 5.6 6.0 5.5 6.2 6.0 6.0 5.5 5.8 5.6 5.7 5.9 6.0 6.1 5.5 5.7 6.1
○ 1.2
○ 0.1
● 0.2
○ 0.5
SHORT ANSWER. Write the word or phrase that best completes each statement or answers the question. Use the range rule of thumb to solve the problem.
15) Weekly sales for the Dade Company average $10,000 with a standard deviation of $450. During a recent week sales were $9050. Is that amount unusually low? Why or why not?
Yes, $9050 is unusually low because it is less than $9100, which is two standard deviations below the mean.
MULTIPLE CHOICE. Choose the one alternative that best completes the statement or answers the question.
Solve the problem. Round results to the nearest hundredth.
16) A department store, on average, has daily sales of $28,176.44. The standard deviation of sales is $ 1500. On Tuesday, the store sold $34,083.30 worth of goods. Find Tuesday’s z score. Was Tuesday an unusually good day?
○ 4.25, yes
● 3.94, yes
○ 4.13, no
○ 3.15, no
Determine which score corresponds to the higher relative position.
17) Which score has a better relative position, a score of 35.1 on a test for which \(\bar x\) = 30 and s = 3, or a score of 299.7 on a test for which \(\bar x\) = 270 and s = 27?
○ A score of 299.7
○ Both scores have the same relative position.
● A score of 35.1
Find the percentile for the data point.
18) Data set: 108 120 112 106 114 116 106 104 111 108 112 122 104 108 110 105; data point 114
○ 62
● 75
○ 85
○ 70
Find the indicated measure.
19) The weights (in pounds) of 30 newborn babies are listed below. Find Q1.
5.5 5.7 5.8 6.0 6.1 6.1 6.3 6.4 6.5 6.6
6.7 6.7 6.7 6.9 7.0 7.0 7.0 7.1 7.2 7.2
7.4 7.5 7.7 7.7 7.8 8.0 8.1 8.1 8.3 8.7
● 6.4
○ 5.8
○ 7.5
○ 6.3
SHORT ANSWER. Write the word or phrase that best completes each statement or answers the question. Identify as many similarities and differences that you can find.
20) Describe any similarities or differences in the two distributions represented by the following boxplots. Assume the two boxplots have the same scale.

Let the boxplot on the left represent distribution A; boxplot on the right, distribution B. Distribution A is uniform; distribution B is skewed to the left. Distribution A has a higher maximum value. Distribution B has a lower minimum value. The median of distribution B exceeds that of A. Both interquartile ranges are the same, implying the variation among the middle 50% of values of each distribution is the same. There are no outliers for either distribution, but distribution B shows more variation.