500 câu trắc nghiệm Kinh tế lượng – 13A

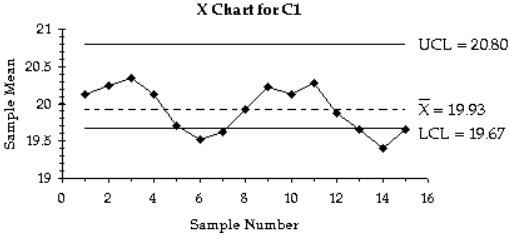
5) A machine that is supposed to fill small bottles to contain 20 ml yields the following data from a
test of 4 bottles every hour.
| S | A | M | R |
| 1 | 19.9 20.1 20.2 20.3 | 20.125 | 0.4 |
| 2 | 20.4 20.0 20.3 20.3 | 20.25 | 0.4 |
| 3 | 20.0 20.7 20.4 20.3 | 20.35 | 0.7 |
| 4 | 20.4 20.1 20.1 19.9 | 20.125 | 0.5 |
| 5 | 19.9 19.8 19.6 19.5 | 19.7 | 0.4 |
| 6 | 19.4 19.4 19.6 19.7 | 19.525 | 0.3 |
| 7 | 19.8 19.4 19.6 19.7 | 19.625 | 0.4 |
| 8 | 19.9 19.8 20.0 20.0 | 19.925 | 0.2 |
| 9 | 20.2 20.3 20.1 20.3 | 20.225 | 0.2 |
| 10 | 20.0 20.3 20.0 20.2 | 20.125 | 0.3 |
| 11 | 20.3 20.5 20.1 20.2 | 20.275 | 0.4 |
| 12 | 20.1 19.9 19.8 19.7 | 19.875 | 0.4 |
| 13 | 19.5 19.8 19.7 19.6 | 19.65 | 0.3 |
| 14 | 19.4 19.8 19.8 19.4 | 19.4 | 0.4 |
| 15 | 19.5 19.6 19.6 19.9 | 19.65 | 0.4 |
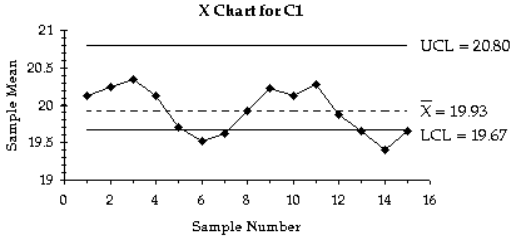
Examine the given run chart or control chart and determine whether the process is within statistical control. If it is not, identify which of the three out-of-control criteria apply.
6) A control chart for \({\bar x}\) is shown below. Determine whether the process mean is within statistical control. If it is not, identify which of the three out-of-control criteria lead to rejection of a statistically stable mean.
Process mean is not within statistical control. One of the points lies above the upper control limit.
7) A control chart for \({\bar x}\) is shown below. Determine whether the process mean is within statistical control. If it is not, identify which of the three out-of-control criteria lead to rejection of a statistically stable mean.
Process mean is not within statistical control. There are points above and below the control limits. There is a cyclical pattern.
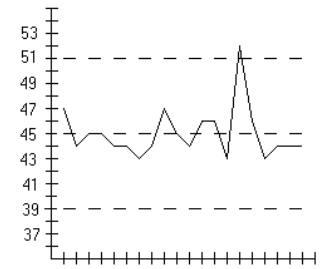
8) A run chart for individual values is shown below. Does there appear to be a pattern suggesting that the process is not within statistical control? If so, describe the pattern.
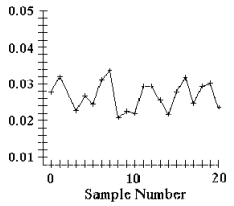
Process appears to be in statistical control.
9)
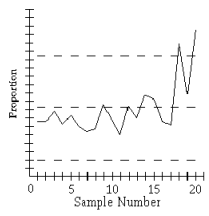
Process appears to be out of statistical control. There are points that lie above the upper control limit.
There are 8 consecutive points below the center line. There is increasing variation.
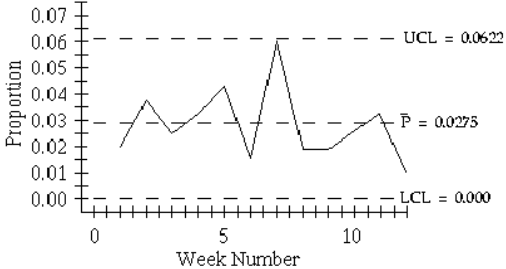
Use the given process data to construct a control chart for p.
10) A manufacturer monitors the level of defects in the television sets that it produces. Each week, 200 television sets are randomly selected and tested and the number of defects is recorded. The results for 12 consecutive weeks are shown below.
4 7 5 6 8 3 12 4 4 5 6 2
Solve the Problem.
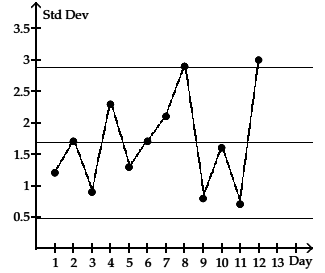
11) A control chart for monitoring variation and center can be based on standard deviations instead of on ranges. An s chart for monitoring variation is made by plotting sample standard deviations with a center line at \({\bar s}\) (the mean of the sample standard deviations) and control limits at B4\({\bar s}\) and B3\({\bar s}\), where B4 and B3 are found in Table 13-2. Construct an s chart for the data below.
A manufacturer of lightbulbs picks 10 lightbulbs at random each day for quality control. The mean, standard deviation, and range (in hours) of the lifetimes of the 10 lightbulbs are calculated. The results for 12 consecutive days are shown in the table below.
| Day | \({\bar x}\) | Range | s |
| 1 | 201.1 | 3.4 | 1.2 |
| 2 | 203.4 | 4.7 | 1.7 |
| 3 | 200.9 | 3.1 | 0.9 |
| 4 | 205.6 | 6.2 | 2.3 |
| 5 | 201.3 | 4.7 | 1.3 |
| 6 | 200.5 | 3.7 | 1.7 |
| 7 | 205.8 | 5.8 | 2.1 |
| 8 | 203.7 | 6.2 | 2.9 |
| 9 | 199.8 | 2.1 | 0.8 |
| 10 | 202.7 | 4.4 | 1.6 |
| 11 | 200.0 | 2.7 | 0.7 |
| 12 | 204.6 | 7.8 | 3.0 |
