500 câu trắc nghiệm Kinh tế lượng – 11C

Use the Minitab display to test the indicated claim.
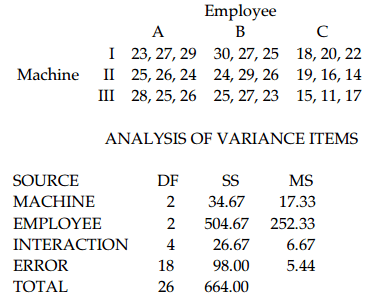
9) A manager records the production output of three employees who each work on three different machines for three different days. The sample results are given below and the Minitab results follow.

Assume that the number of items produced is not affected by an interaction between employee and machine. Using a 0.05 significance level, test the claim that the choice of employee has no effect on the number of items produced.
H0: There is no employee effect.
H1: There is an employee effect.
Test statistic: F = 46.3842. Critical value: F = 3.5546.
Reject the null hypothesis. The employee does appear to have an effect on the number of items produced.
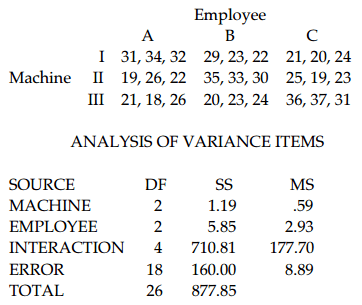
10) A manager records the production output of three employees who each work on three different machines for three different days. The sample results are given below and the Minitab results follow.

Assume that the number of items produced is not affected by an interaction between employee
and machine. Using a 0.05 significance level, test the claim that the machine has no effect on the number of items produced.
H0: There is no machine effect.
H1: There is a machine effect.
Test statistic: F = 3.1857. Critical value: F = 3.5546.
Fail to reject the null hypothesis. The type of machine does not appear to have an effect on the number of items produced.
11) A manager records the production output of three employees who each work on three different machines for three different days. The sample results are given below and the Minitab results follow.

Using a 0.05 significance level, test the claim that the interaction between employee and machine has no effect on the number of items produced.
H0: There is no interaction effect.
H1: There is an interaction effect.
Test statistic: F = 19.9888. Critical value: F = 2.9277.
Reject the null hypothesis. There does appear to be an interaction effect.
Use the data in the given table and the corresponding Minitab display to test the hypothesis.
12) The following table shows the mileage for four different cars and three different brands of gas. Assuming no effect from the interaction between car and brand of gas, test the claim that the four cars have the same mean mileage. Use a 0.05 significance level.
| Brand 1 | Brand 2 | Brand 3 | |
| Car 1 | 22.4 | 25.2 | 24.3 |
| Car 2 | 19 | 18.6 | 19.8 |
| Car 3 | 24.6 | 25 | 25.4 |
| Car 4 | 23.5 | 23.6 | 24.1 |
| Source | DF | SS | MS | F | p |
| Car | 3 | 61.249 | 20.416 | 39.033 | 0.000249 |
| Gas | 2 | 2.222 | 1.111 | 2.124 | 0.200726 |
| Error | 6 | 3.138 | 0.523 | ||
| Total | 11 | 66.609 |
H0: The cars have the same mean mileage. H1: The cars do not have the same mean mileage. The
P-value is 0.000249, which is less than 0.05. We reject the null hypothesis; it appears that the cars do not have the same mean mileage.
13) The following minitab display results from a study in which three different teachers taught calculus classes of five different sizes. The class average was recorded for each class. Assuming no effect from the interaction between teacher and class size, test the claim that the teacher has no effect on the class average. Use a 0.05 significance level.
| Source | DF | SS | MS | F | p |
| Teacher | 2 | 56.93 | 28.47 | 1.018 | 0.404 |
| Class Size | 4 | 672.67 | 168.17 | 6.013 | 0.016 |
| Error | 8 | 223.73 | 27.97 | ||
| Total | 14 | 953.33 |
H0: There is no teacher effect. H1: There is a teacher effect. The P-value is 0.404, which is greater than 0.05. We fail to reject the null hypothesis; it appears that the teacher does not affect the class average.
14) The following table shows the mileage for four different cars and three different brands of gas. Assuming no effect from the interaction between car and brand of gas, test the claim that the three brands of gas provide the same mean gas mileage. Use a 0.05 significance level.
| Brand 1 | Brand 2 | Brand 3 | |
| Car 1 | 22.4 | 25.2 | 24.3 |
| Car 2 | 19 | 18.6 | 19.8 |
| Car 3 | 24.6 | 25 | 25.4 |
| Car 4 | 23.5 | 23.6 | 24.1 |
| Source | DF | SS | MS | F | p |
| Car | 3 | 61.249 | 20.416 | 39.033 | 0.000249 |
| Gas | 2 | 2.222 | 1.111 | 2.124 | 0.200726 |
| Error | 6 | 3.138 | 0.523 | ||
| Total | 11 | 66.609 |
H0: The brands of gas provide the same mean mileage. H1: The brands of gas do not provide the same mean mileage. The P-value is 0.200726, which is greater than 0.05. We fail to reject the null hypothesis; it appears that the brands of gas provide the same mean mileage.
Provide an appropriate response.
15) The following data shows annual income, in thousands of dollars, categorized according to the two factors of gender and level of education. Assume that incomes are not affected by an interaction between gender and level of education, and test the null hypothesis that level of education has no effect on income. Use a 0.05 significance level.
| Female | Male | |
| High school | 23, 27, 24, 26 | 25, 26, 22, 24 |
| College | 28, 36, 31, 33 | 35, 32, 39, 28 |
| Advanced degree | 41, 38, 43, 49 | 35, 50, 47, 44 |
H0: Education level has no effect on income. H1: Education level has an effect on income. The test statistic is F = 41.26823, and the corresponding P-value is 0.000000189. Because the P-value is less than 0.05, we reject the null hypothesis that education level has no effect on income. It appears that education level does have an effect on income.
16) The following data contains task completion times, in minutes, categorized according to the gender of the machine operator and the machine used.
| Male | Female | |
| Machine 1 | 15, 17 | 16, 17 |
| Machine 2 | 14, 13 | 15, 13 |
| Machine 3 | 16, 18 | 17, 19 |
Assume that two-way ANOVA is used to analyze the data. How are the ANOVA results affected if the times are converted to hours?
The ANOVA results are not affected by converting the times to hours. The null hypothesis of no interaction between machine and gender is not rejected since the P-value is 0.946. The null hypothesis of no effect from machine is rejected since the P-value is 0.013. The null hypothesis of no effect from gender is not rejected since the P-value is 0.382.